For many people, the word “statistics” triggers a very specific memory: a whiteboard full of Greek letters, a teacher moving too fast, and the sinking feeling of being lost by week three. But here’s the secret the maths classroom never told you — statistics isn’t really about maths. It’s about stories hidden in data, about learning to spot when numbers are lying to you, and about answering questions you actually care about. You can learn statistics as a complete beginner without hating maths, because the maths involved is mostly arithmetic wearing a fancy costume.
Why Statistics Feels Hard (and Why It Isn’t)
Statistics has a branding problem. It’s usually taught as a branch of mathematics — formulas first, intuition never — when it’s actually closer to detective work. The core questions are gloriously non-mathematical: Is this claim believable? Could this result just be luck? What’s the story this data is telling?
The actual computation is modest. Means, medians, percentages, and basic probability cover an enormous amount of ground. The hard part — and the interesting part — is interpretation: understanding what a number means, what it doesn’t mean, and how it could mislead. If you can follow an argument, you can learn statistics. The formulas are just shorthand.
Start With Questions You Care About
Abstract datasets about widget factories kill curiosity. Real questions ignite it. Pick something you genuinely want to know: Do expensive headphones actually sound better? Is it really rainier in Manchester than London? Do football teams that dominate possession actually win more?
Then learn each statistical idea as the tool that answers your question. Mean and median become tools for “what’s typical?” Variation becomes “how spread out is this?” Correlation becomes “do these move together?” — and the crucial follow-up, “does that mean one causes the other?” (It doesn’t, necessarily — the most important sentence in all of statistics.) Learning tools in service of curiosity feels nothing like memorising formulas for an exam.
The Five Ideas That Unlock Everything
1. Averages lie (sometimes). The mean is dragged by outliers — one billionaire in a room makes the “average” wealth absurd. The median (middle value) often tells a truer story. Knowing which average someone chose — and why — is a superpower for reading news critically.
2. Variation matters as much as the average. Two classes can both average 60% while one has everyone near 60 and the other splits between 30 and 90. Same average, totally different stories. Spread (range, standard deviation) completes the picture.
3. Samples aren’t populations. A poll of 1,000 people can represent 60 million — if sampled properly. “Properly” means randomly, not “asked my followers.” Most misleading statistics trace back to bad sampling.
4. Correlation isn’t causation. Ice cream sales and drownings rise together (summer causes both). Whenever you see “linked to” in a headline, ask what third factor might explain it.
5. Uncertainty is quantifiable. “Margin of error ±3%” isn’t vagueness — it’s honesty about precision. Learning to read uncertainty makes you calmer and smarter about every number you meet.
The Royal Statistical Society’s public resources explain these ideas beautifully for non-mathematicians, and BBC Bitesize covers the school-level foundations clearly if you want to patch gaps.
Learn by Doing: The Spreadsheet Method
The fastest way to make statistics click is to compute things yourself on real data — and a spreadsheet is all you need. Download a dataset that interests you (UK government open data at data.gov.uk is a goldmine: crime stats, school results, transport figures), and start asking questions.
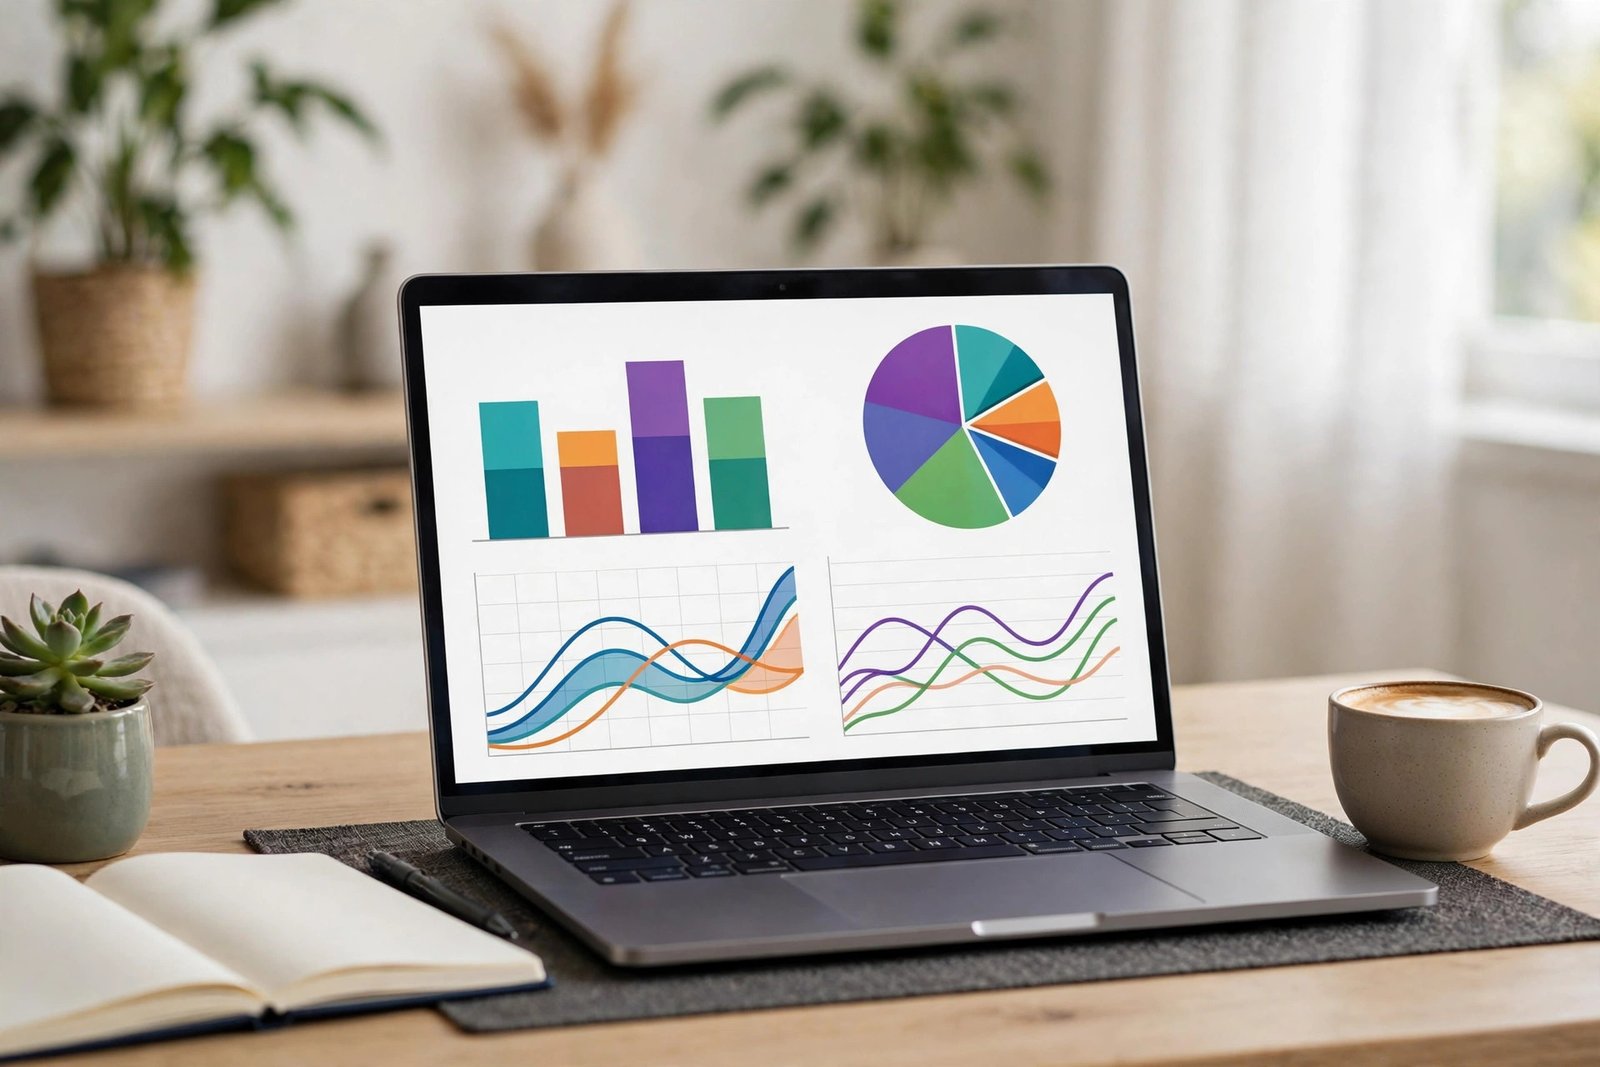
Calculate averages. Make a chart. Sort, filter, compare. When you build a bar chart yourself and see the story emerge, the concept sticks in a way no lecture achieves. Each small project teaches two or three ideas painlessly, and after five or six projects you’ve absorbed the fundamentals without a single scary formula sheet. If you’re at university, the right digital tools help enormously — see the best AI tools for university students for study aids that actually work.
Books and Courses That Don’t Feel Like Maths Class
Books: “The Art of Statistics” by David Spiegelhalter (a masterclass in intuition-first explanation), “How to Lie with Statistics” by Darrell Huff (short, funny, and permanently eye-opening), and “Naked Statistics” by Charles Wheelan (statistics as storytelling). All assume minimal maths.
Courses: free introductory statistics courses on major learning platforms typically need only school-level arithmetic. Look for ones emphasising interpretation and real examples over proof and derivation — the course description usually signals which flavour you’re getting.
Practice: puzzles help. Websites with daily data quizzes, “guess the correlation” games, and probability puzzles train statistical intuition the way crosswords train vocabulary. For classroom context on how data skills are evolving, how UK schools are using AI in classrooms shows where education is heading.
Statistics in the News: A Reader’s Toolkit
Once you know the basics, British news becomes a daily practice ground. When a headline screams “risk doubles!”, ask: doubles from what? A risk rising from 1 in 10,000 to 2 in 10,000 is a doubled relative risk and a negligible absolute one — but only the scary version makes the headline. When a poll claims a dramatic swing, check the sample size and margin of error before believing it. When a “study shows” claim appears, ask who funded it and how many people were studied.
This critical habit is the real payoff of learning statistics. You’re not training to become a data scientist — you’re training to be the person in the room who can’t be fooled by a misleading graph. In a world drowning in numbers deployed as weapons, that’s close to a superpower.
Conclusion
Statistics isn’t maths with extra steps — it’s structured common sense about data, and the maths is mostly arithmetic. Start with questions you care about, learn five core ideas, get your hands dirty with a spreadsheet, and read one good popular book. You’ll end up not just tolerating statistics but wielding it: spotting dodgy headlines, making sharper decisions, and understanding the numbered world with a clarity most people never achieve. The whiteboard of Greek letters was never the point. The detective work was.
Frequently Asked Questions
Do I need to be good at maths to learn statistics?
No. Introductory statistics needs basic arithmetic — adding, dividing, percentages. The challenging part is interpretation and logical thinking, not computation. Spreadsheets and calculators handle the number-crunching.
What’s the difference between statistics and probability?
Probability reasons from causes to effects (if I flip this coin, what happens?). Statistics reasons from effects to causes (these are the results — what can I infer?). They’re deeply connected, but statistics is the one you’ll use to interpret the world.
How long does it take to learn basic statistics?
A few weeks of casual study covers the core ideas (averages, variation, correlation, sampling, basic inference). Genuine comfort with real datasets takes a few months of hands-on practice — which is fun if you’re working on questions you care about.
Is statistics useful outside science and finance?
Enormously. Marketing, sport, journalism, public policy, medicine, and everyday decisions (should I trust this review? is this health scare real?) all run on statistical reasoning. It’s arguably the most generally useful quantitative skill there is.
What’s the single most important statistical concept?
That correlation doesn’t imply causation — and more broadly, that every number needs context: who collected it, how, from whom, and what they’re not telling you. That sceptical habit outperforms any formula.